Construction WIP Reporting: Methods, Examples, Template
Work in progress (WIP) reports track project progress, revenue, and profitability. Learn how to build accurate WIP reports with examples and an Excel template. We're a CPA-led firm based in the Midwest, supporting contractors across the U.S.
 Allen Frantsen, CPA, Principal Consultant
Updated: 5/6/2026 - 9 min read
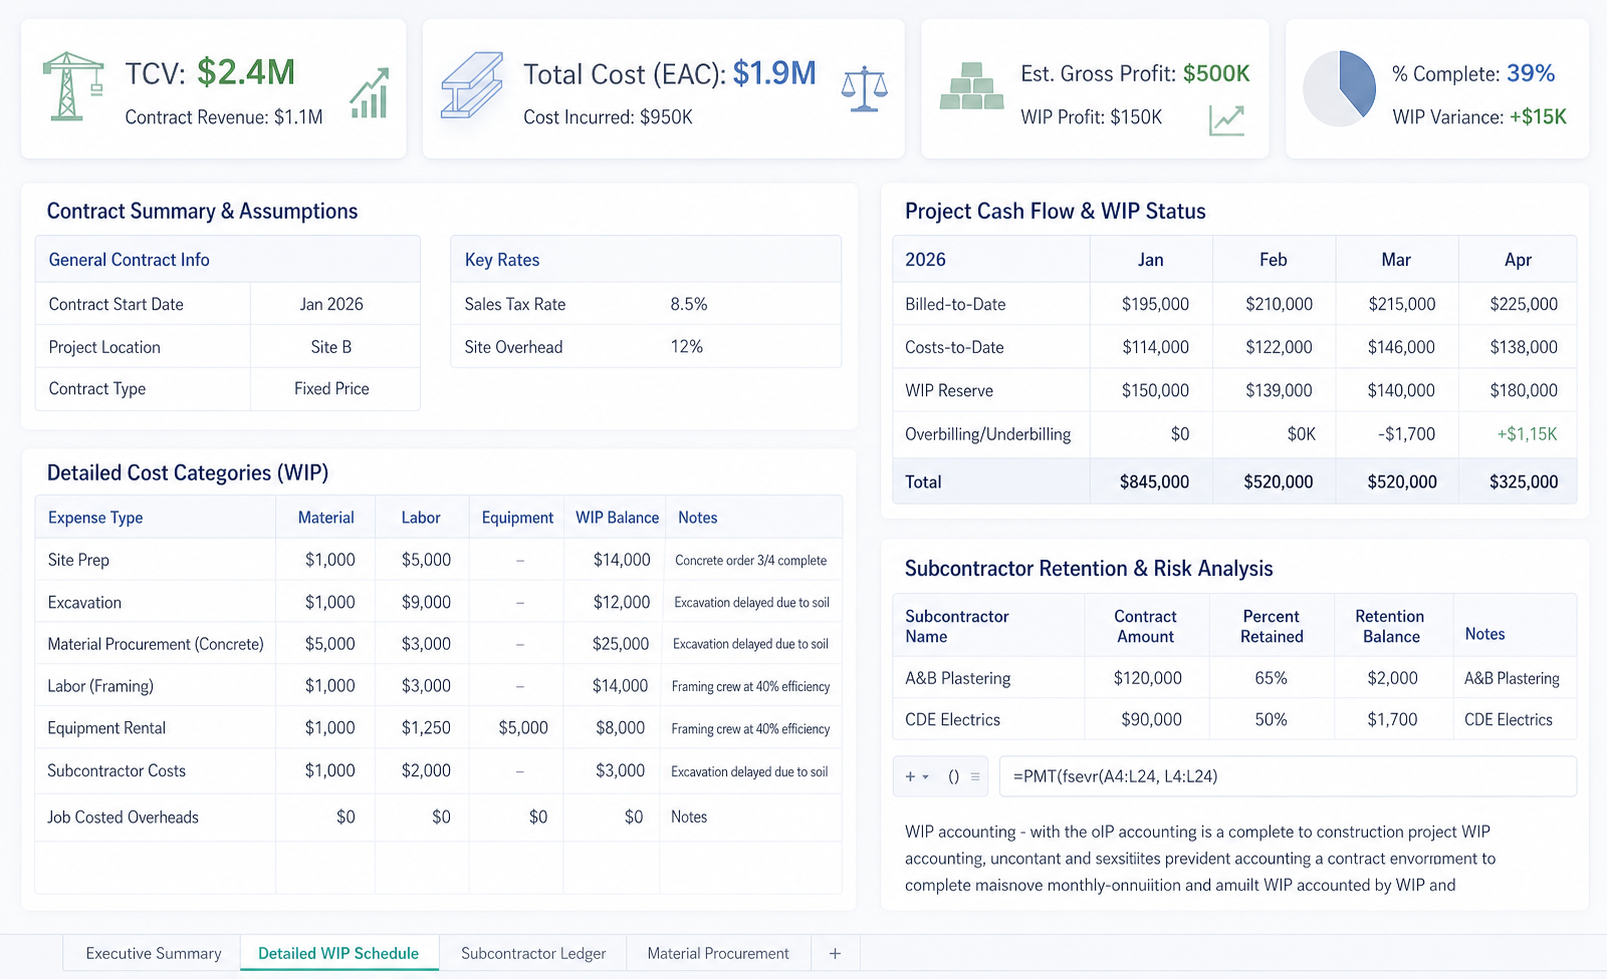
Table of Contents
- WIP Defined
- WIP Calculations
- WIP Reports
- Full Example
- Construction Billing
- Journal Entries
- Report Mistakes
- Financial Modeling
- Excel Template
- Reporting Systems
- Reporting Services
- FAQ
What is Work in Progress (WIP)
Work in progress (WIP) measures the progress of ongoing work, showing what has been completed and what remains to be done. It is used to track project performance, forecast costs and materials, and keep teams and stakeholders aligned as work progresses.
At a financial level, WIP connects project activity to accounting by estimating percent complete and earned revenue, and indicating whether a project is overbilled or underbilled. This allows teams to understand how much revenue has been earned relative to what has been invoiced, providing a clearer foundation for forecasting and budget control.
At its simplest, WIP compares earned revenue to billings and is calculated with the following formula:
WIP = Earned Revenue − Billings
Earned revenue is typically calculated using the cost-to-cost method:
Earned Revenue = (Cost Incurred ÷ Estimated Total Cost) × Contract Value
Since earned revenue equals cost plus earned profit, WIP can also be expressed as:
WIP = (Cost + Earned Profit) − Billings
When earned revenue and billings don’t match, it impacts your cash flow. If you’re underbilled, you are essentially financing the owner’s project with your own cash. If you’re overbilled, you have a cash cushion, but you still owe the work. The table below demonstrates this:
| Scenario | Result | GL Status | Meaning |
|---|---|---|---|
| Earned > Billed | Positive WIP | Underbilled (Asset) | You've done more work than you've been paid for. You are "loaning" the client money. |
| Billed > Earned | Negative WIP | Overbilled (Liability) | You've collected more cash than work performed. You "owe" the client labor/materials. |
WIP Calculation Methods
These methods determine percent complete, which drives earned revenue and ultimately WIP.
- Cost-to-Cost: The most common method, comparing costs incurred to total estimated costs to calculate percent complete.
- Cost-to-Finish: Uses remaining estimated costs to better reflect future obligations and project completion.
- Units / Output-Based: Measures progress based on completed units, milestones, or deliverables rather than costs.
- Custom / Hybrid Approach: Combines cost-to-cost calculations with updated estimates, known future costs, and adjustments for change orders or timing differences to reflect the project's actual status.
Large amounts of uninstalled materials, timing differences, and change orders can distort results if not properly adjusted. As a result, many teams use hybrid approaches that adjust standard calculations to produce a more accurate view of project progress.
What is a Construction WIP Report?
A construction WIP report is a financial report that tracks the status of active projects by comparing costs, billings, and estimated completion. It provides a snapshot of how each job is performing at a given point in time and connects project activity to financial results.
A typical WIP report includes:
- Contract value (including approved change orders)
- Costs to date
- Estimated cost to complete
- Revised total estimated costs
- Billings to date
- Percent complete
- Earned revenue
- Overbilling or underbilling position
WIP reports are commonly built using Excel, accounting systems, or internal dashboards, depending on the complexity of the business. The most common format is a job-level summary, where each row represents a project and columns capture key metrics such as contract value, costs to date, percent complete, earned revenue, and over- or underbilling. Percent complete is typically calculated using cost-to-cost estimates and updated project data from accounting systems.
Supporting the summary view, many companies also maintain detailed project-level tracking, recording costs, revenue, and billings at monthly or periodic intervals. This allows teams to monitor how projects evolve over time, identify trends earlier, capture project-level notes, and better understand the timing of costs, revenue recognition, and cash flow.
Regardless of format, the goal of a WIP report is to provide a consistent view of project performance across all active jobs. As companies take on more projects or face increasing complexity, more structured workflows and systems can help improve data consistency, streamline reporting, and identify issues earlier in the project lifecycle.
WIP Example
The most common WIP method is cost-to-cost, where progress is measured based on costs incurred relative to total estimated cost.
Base Calculation
- Contract Value: $1,000,000
- Estimated Total Cost: $800,000
- Cost to Date: $400,000
Percent Complete: $400,000 ÷ $800,000 = 50%
Earned Revenue: 50% × $1,000,000 = $500,000
If billings to date are $450,000, the project is:
$500,000 − $450,000 = $50,000 underbilled
This represents a WIP asset because earned revenue exceeds billings.
Uninstalled Materials Adjustment
Assume $150,000 of the cost to date is materials purchased but not yet installed. If included without adjustment, percent complete and earned revenue can be overstated.
Adjusted Cost to Date: $400,000 − $150,000 = $250,000
Adjusted Percent Complete: $250,000 ÷ $800,000 = 31.25%
Adjusted Earned Revenue: 31.25% × $1,000,000 = $312,500
This provides a more accurate view of actual project progress. Without this adjustment, revenue and profit may be overstated early in the project, creating margin reversals later.
Key Takeaway
WIP = Earned Revenue − Billings
- If earned revenue exceeds billings, the project is underbilled and creates a WIP asset.
- If billings exceed earned revenue, the project is overbilled and creates a WIP liability.
Construction Billing
Billing on construction projects is typically based on contract terms, not directly on costs incurred. The most common approach is a Schedule of Values (SOV), where the project is broken into components such as framing, electrical, or finishes, and invoices are submitted based on progress against those components.
For example, if framing represents $300,000 of a project and is estimated to be 50% complete, the contractor may invoice $150,000 for that portion of the work.
Another common approach is milestone billing, where invoices are tied to specific events such as project start, completion of a phase, or final delivery.
Because billing follows contract structure rather than actual costs incurred, billings rarely match earned revenue exactly. This difference is what creates either an underbilled or overbilled WIP position.
WIP Journal Entries
The following entries illustrate how costs, billings, and revenue are recorded in a typical construction WIP process. These entries support the calculations shown in the example above.
Traditional Approach (CIP with Billings)
Many construction accounting systems use a Construction in Progress (CIP) account along with a Billings account to track earned revenue versus invoicing.
Record Costs
Dr Work in Progress (CIP)
Cr Accounts Payable / Cash
Record Billings (including down payments)
Dr Accounts Receivable
Cr Billings
Recognize Revenue
Dr Cost of Goods Sold
Dr Work in Progress (profit portion)
Cr Revenue
This terminology can create confusion because CIP is also commonly used for internal capital projects. Some companies use WIP instead, but then the formula for net WIP becomes WIP minus Billings, which can also be confusing.
Keeping a separate CIP-style account can simplify reporting, since net WIP becomes a straightforward calculation or query:
Net WIP = CIP GL balance − Billings GL balance
The important point is to use account names consistently so earned revenue, billings, and the net WIP position can be pulled clearly from the general ledger or reporting system.
Modern Systems (Contract Asset / Deferred Revenue)
Modern systems such as NetSuite may separate billing activity from revenue recognition depending on project setup and billing rules. Instead of relying on explicit WIP or CIP accounts, these systems can support multiple billing and revenue recognition workflows.
Billing After Work Is Completed
For time and materials billing or completed milestones, invoices may be recognized immediately as revenue once the work has been performed.
Dr Accounts Receivable
Cr Revenue
Billing Before Work Is Completed
For deposits, mobilization payments, or advance billings, invoices may initially be recorded as deferred revenue until the related work is completed.
Dr Accounts Receivable
Cr Deferred Revenue
Revenue Recognized Later
Dr Deferred Revenue
Cr Revenue
Underbilled Revenue
If earned revenue exceeds billings, the remaining earned amount may be recorded as a contract asset until invoiced.
Dr Contract Asset
Cr Revenue
Although accounting workflows vary by system configuration, the underlying WIP calculation remains the same: earned revenue compared to billings determines whether a project is underbilled or overbilled.
Common WIP Report Mistakes
WIP reports are only as reliable as the data and assumptions behind them. It’s common to assume a project is performing well simply because costs to date are within budget, but this often misses how much work has actually been completed.
For example, a project may appear 70% complete based on costs incurred, while only 50% of the work is actually finished. Without updated estimates and proper calculations, WIP reports can give a misleading view of project performance.
Common mistakes include:
- Confusing percent spent with percent complete
- Not tracking committed costs, such as purchase orders or subcontract agreements
- Delayed or inconsistent updates to cost and billing data
- Using overbilling as profit instead of recognizing it as future work
- Data entry errors in manual or spreadsheet-based reports
- Not tying WIP adjustments to financial statements
Most WIP issues are not caused by the calculation method itself, but by inconsistent inputs, outdated estimates, and a lack of structured processes. In practice, we often see these issues driven by weak or disconnected systems, leading to inefficient and inaccurate WIP reporting.
WIP for Financial Modeling
WIP reporting is not just a financial snapshot; it becomes a core input for financial modeling when the underlying data is structured correctly. Tracking change orders, labor, costs, and project timelines creates clean, consistent inputs that can be used to forecast performance across active jobs. When this data is reliable, it allows teams to model expected revenue, costs, and outcomes without relying solely on assumptions.
WIP plays a critical role in identifying issues early. By comparing percent complete, costs to date, and updated estimates, teams can quickly spot projects that are trending unprofitable and adjust course. This may include revising budgets, reallocating resources, or addressing scope and pricing before margins are fully eroded. Without this visibility, problems are often only discovered after the project is complete.
Over time, WIP data becomes a foundation for future decision-making. Historical performance, cost trends, and project outcomes can be used to improve pricing, refine estimates, and plan new work with greater accuracy. In this way, WIP reporting moves beyond tracking; it becomes a structured dataset that supports forecasting, margin planning, and long-term business growth.
WIP Excel Reporting Template
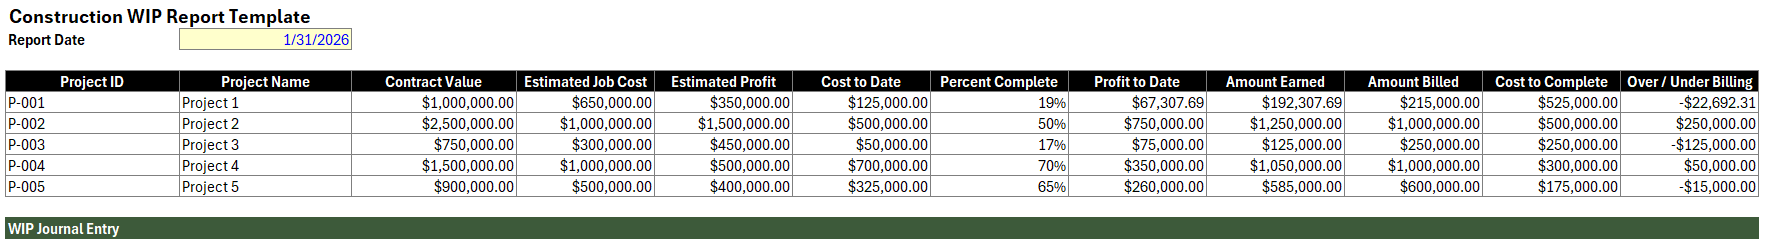
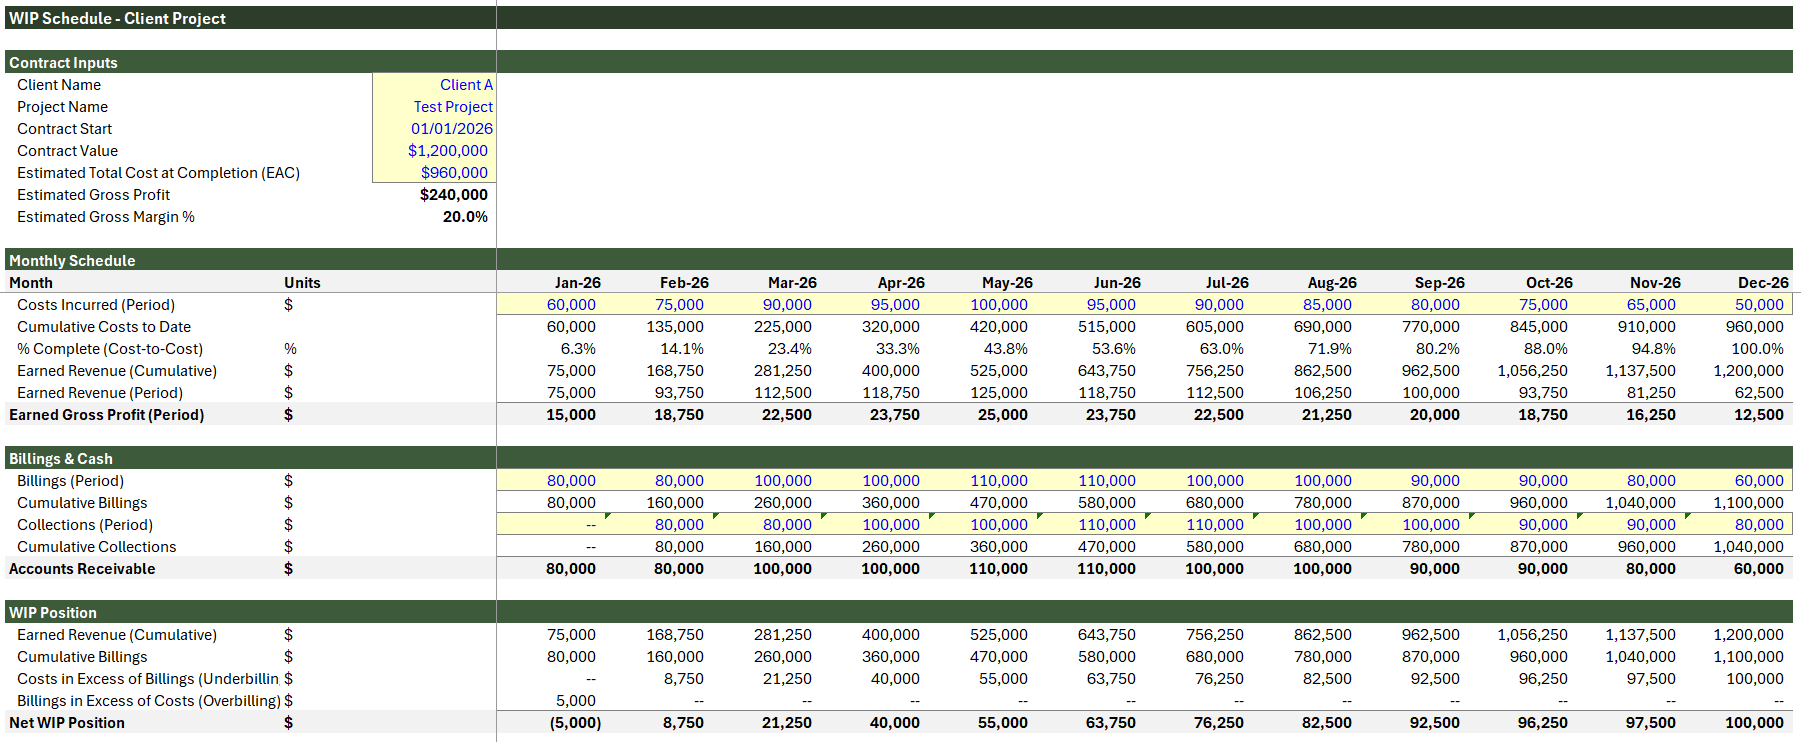
This WIP Excel template includes two views: a dedicated, detailed project view for tracking over/under billings by month, and a summary dashboard that consolidates multiple projects using source inputs like billings for easy entry. With this, you can start tracking projects based on your current setup while gaining visibility into cumulative costs, earned revenue, and over- or underbilled positions.
While many WIP reports focus on simple job-level summaries, this structure provides a deeper view of performance and highlights timing differences between costs and billings. It allows you to monitor trends across periods, compare project performance, and identify issues earlier, while still serving as a flexible foundation you can expand as your reporting needs grow.
Through our Excel consulting services, we help companies restructure and rebuild messy WIP workflows directly in Excel. This often includes cleaning up source data, standardizing calculations, and designing worksheets that are easier to maintain. From there, we can expand into more advanced solutions as needed, including custom workflow development.
WIP Reporting Systems
Many companies start with Excel-based WIP reporting, using templates to track job performance and support month-end reporting. As projects scale, Excel processes become harder to maintain. Challenges like tracking uninstalled materials, managing change orders, and keeping estimates aligned across accounting and project teams can quickly introduce errors and inconsistencies.
At that point, moving to a lightweight web application can significantly improve accuracy and efficiency. The systems we build are customized to your company’s workflows and designed to integrate with your existing tools, including:
- QuickBooks
- Foundation
- Oracle Construction
- Spectrum (Trimble)
- Accubid
- ProjectSight
Monthly WIP Reporting Services
With our construction accounting services, we support ongoing monthly WIP reporting, including data extraction, SQL-based reporting, and custom tools to manage percentage completion. For systems such as Foundation, which uses SQL Server, we offer ODBC integrations and custom reporting to improve visibility across project costs, earned revenue, billings, and job performance.Frequently Asked Questions
What is a WIP report in construction?
A construction WIP (Work in Progress) report tracks the financial status of active projects by comparing costs, billings, and estimated completion. It provides a snapshot of project performance, including percent complete, earned revenue, and whether a job is over- or underbilled.
How is a WIP report used?
A WIP report is used to monitor project performance, forecast revenue, and identify potential issues early. By comparing costs to date, percent complete, and billings, teams can spot overruns, adjust budgets, and make informed decisions about pricing, staffing, and resource allocation.
Why is WIP reporting important?
WIP reporting is important because it provides visibility into project profitability before a job is complete. Accurate WIP helps prevent cost overruns, improves cash flow management, supports revenue recognition, and ensures financial statements reflect true project performance.
What is the difference between CIP and WIP in construction accounting?
Construction in Progress (CIP) and Work in Progress (WIP) are accounting holding accounts used to track costs on unfinished projects, but they are traditionally associated with different purposes. Broadly, CIP is tied to internal capital projects and fixed assets, while WIP is more commonly associated with contractor job costing and percentage-of-completion reporting. In practice, the terminology can become confusing because many contractor accounting systems still use CIP-style general ledger accounts to accumulate project costs before comparing against billings to determine the net WIP position.
ABOUT THE AUTHOR